[cassandra] Evaluate changing the compression of the directory_entry table from lz4 to zstd
The page dedicated to the data compression explains the zstd should ahave a better compression ratio than lz4 at the price of a little overhead https://cassandra.apache.org/doc/latest/cassandra/operating/compression.html
The current ration is ~0.6 in production and 0.7 in
cassandra01 ~ % /opt/cassandra/bin/nodetool -h cassandra01 -u cassandra --password [redacted] tablestats swh.directory_entry | grep -i -e table: -e "compression ratio"
                Table: directory_entry
                SSTable Compression Ratio: 0.6141515791511662
cassandra1.staging ~ % /opt/cassandra/bin/nodetool -u cassandra --password [redacted] tablestats swh.directory | grep -i -e table: -e "compression ratio"
Table: directory
SSTable Compression Ratio: 0.7396605961670907Staging could be used to evaluate the gain or lose of changing the compression. The compression level can also be evaluated. The default level is 3 on a range of 0 to 22.
According to the documentation, zstd level 1 is the equivalent of lz4.
Benchmarks should be performed for the read performace as the write impact will not be visible by the clients, only by the compactor.
The main question is if it will be possible to recompact the entire directory_entry table in production with the limited remaining space
Activity
changed milestone to %Cassandra in production as primary storage [Roadmap - Tooling and infrastructure]
added cassandra label
assigned to @vsellier

Looks like the fine docs tell me that:
the existing SSTables will not be modified until they are compacted - if an operator needs compression changes to take effect immediately, the operator can trigger an SSTable rewrite using nodetool scrub or nodetool upgradesstables -a, both of which will rebuild the SSTables on disk, re-compressing the data in the process.
Some benchmarks were performed on staging based on the directory_ls with the lz4 compression:
- The measurement was made using gatling and calling the directory_ls rest api for a pre-computed list of 100_000 directories ids
- The storage was configured to run with 10 pods with 10 pods configured with 8 gunicorn workers and 4 threads
- The number of concurrent request was chosen to maximise the cassandra I/Os
Results:
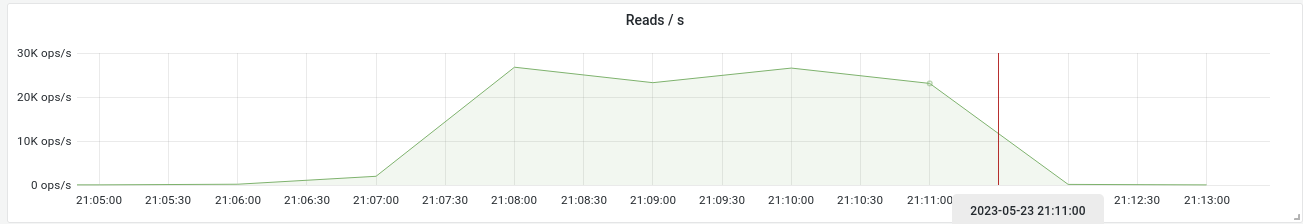
-
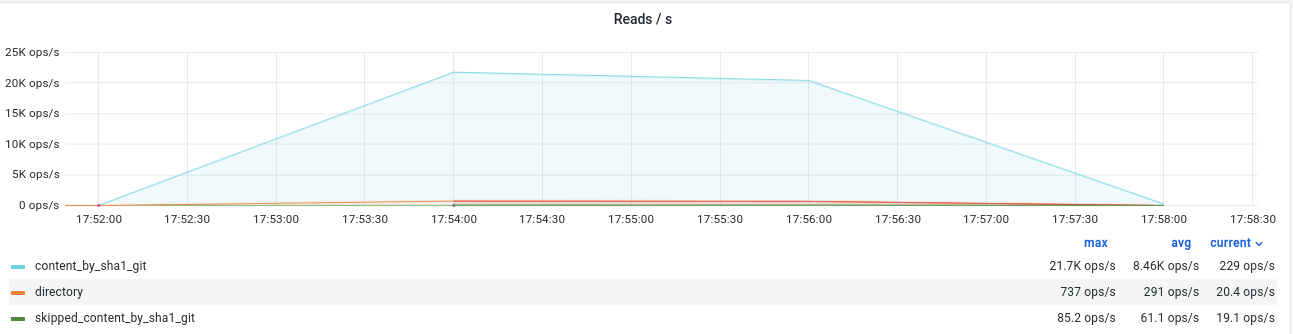
Cassandra seems to have a maximum of 30_000 read per second for this workload
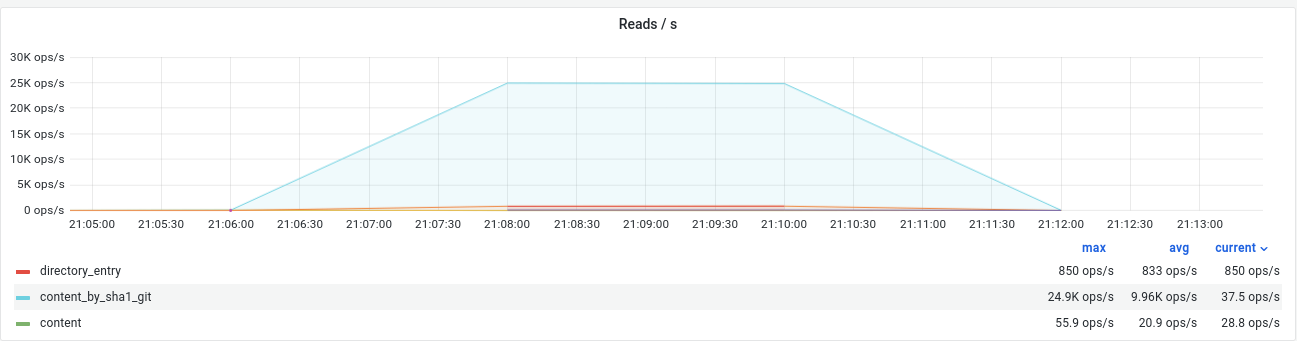
-
The read are dispatched on 3 tables directory (max 60/s), directory_entry (850/s) and content_by_sha1_git (25_000/s). It's not the perfect expected repartition as we want to test the compression on directory_entry. as everything is ready for this test, the compression can be updated for content_by_sha1_git to check the impact on a small table.
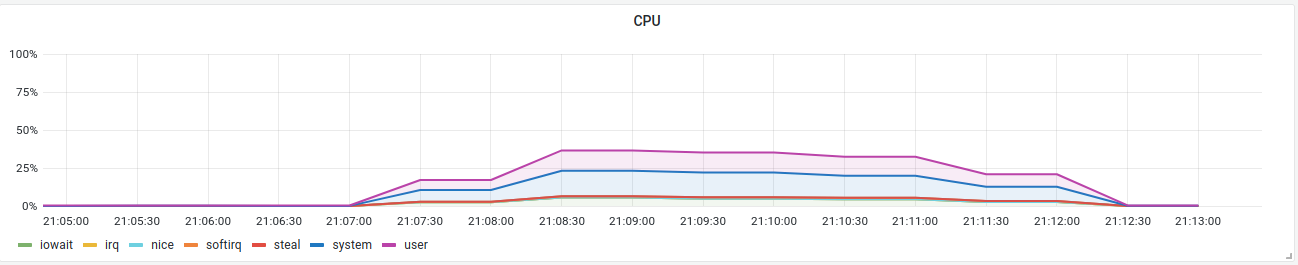
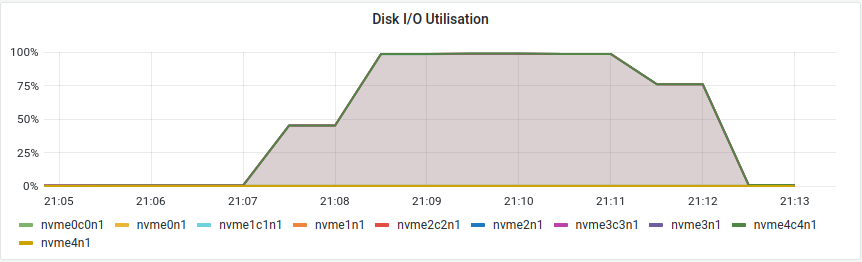
-
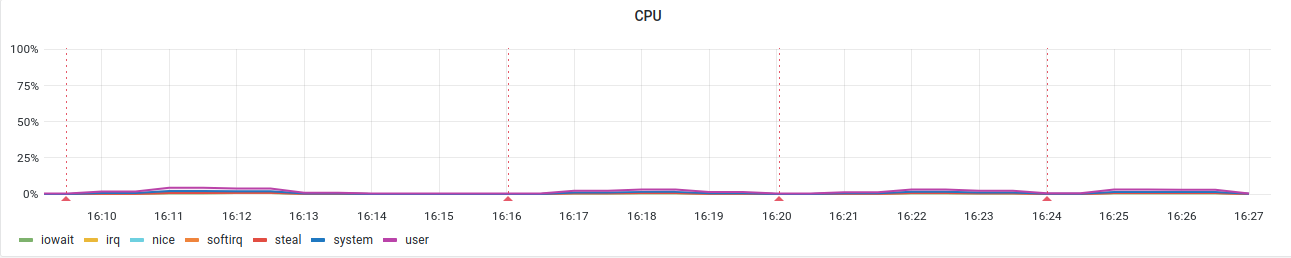
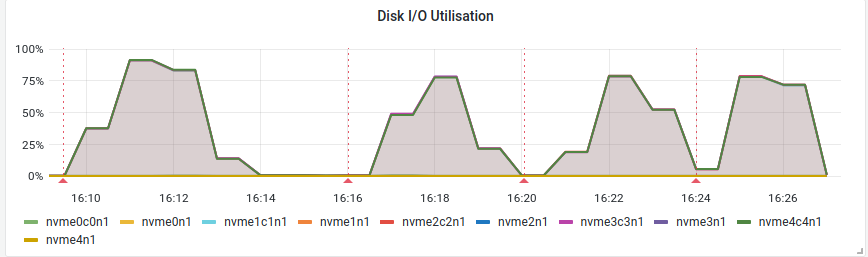
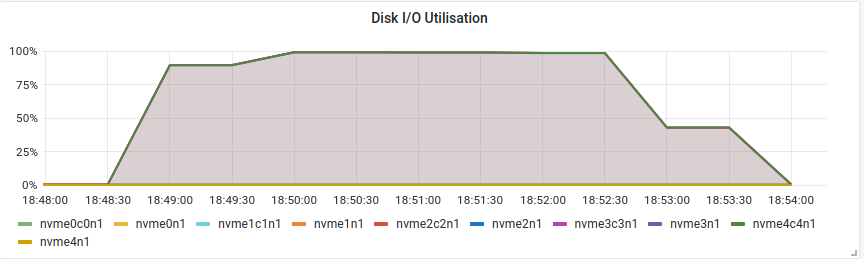
The load of one of the cassandra server during the test
The raw measures:
Users 99th percentile 95th percentile 75th percentile 50th percentile Mean 50 2162 722 194 101 235 100 2158 778 296 105 244 150 4033 1200 256 123 344 200 5246 1855 379 161 474 The same measures will be done with the directory_get_entries rpc call before changing the compression
The same for directory_get_entires:
- server load:
- table read (on directory and directory_entries)


Response times:
Users 99th percentile 95th percentile 75th percentile 50th percentile Mean 50 149 80 40 27 35 100 204 131 75 49 59 150 351 205 112 71 89 200 431 263 147 94 114 500 810 572 359 239 286 For the record, these are the table information before the compression algorithm update:
- content_by_sha1git
% /opt/cassandra/bin/nodetool -u cassandra --password $PASS tablestats swh.content_by_sha1_git Total number of tables: 85 ---------------- Keyspace : swh Read Count: 3059082135 Read Latency: 0.10523843867206266 ms Write Count: 24985155742 Write Latency: 0.1810914381202019 ms Pending Flushes: 0 Table: content_by_sha1_git SSTable count: 14 Old SSTable count: 0 Space used (live): 67276440268 Space used (total): 67276440268 <---------------------------------- Space used by snapshots (total): 0 Off heap memory used (total): 1429886848 SSTable Compression Ratio: 0.7896841476022384 <-------------------- Number of partitions (estimate): 951620786 Memtable cell count: 155728 Memtable data size: 5761788 Memtable off heap memory used: 0 Memtable switch count: 1332 Local read count: 645180450 Local read latency: 0.191 ms Local write count: 942664360 Local write latency: 0.022 ms Pending flushes: 0 Percent repaired: 99.68 Bytes repaired: 46.412GiB Bytes unrepaired: 150.978MiB Bytes pending repair: 0.000KiB Bloom filter false positives: 14403710 Bloom filter false ratio: 0.00000 Bloom filter space used: 1169602000 Bloom filter off heap memory used: 1169601888 Index summary off heap memory used: 235874496 Compression metadata off heap memory used: 24410464 Compacted partition minimum bytes: 43 Compacted partition maximum bytes: 60 Compacted partition mean bytes: 60 Average live cells per slice (last five minutes): 1.0 Maximum live cells per slice (last five minutes): 1 Average tombstones per slice (last five minutes): 1.0 Maximum tombstones per slice (last five minutes): 1 Dropped Mutations: 0 Droppable tombstone ratio: 0.00000- directory
% /opt/cassandra/bin/nodetool -u cassandra --password $PASS tablestats swh.directory Total number of tables: 85 ---------------- Keyspace : swh Read Count: 3059083866 Read Latency: 0.10523846629610513 ms Write Count: 24985162328 Write Latency: 0.18109139716236466 ms Pending Flushes: 0 Table: directory SSTable count: 17 Old SSTable count: 0 Space used (live): 55223380051 Space used (total): 55223380051 <-------------------------------- Space used by snapshots (total): 0 Off heap memory used (total): 1298811128 SSTable Compression Ratio: 0.7397646237926044 <------------------ Number of partitions (estimate): 856544892 Memtable cell count: 486401 Memtable data size: 21888045 Memtable off heap memory used: 0 Memtable switch count: 1279 Local read count: 558936385 Local read latency: 0.148 ms Local write count: 851785925 Local write latency: 0.030 ms Pending flushes: 0 Percent repaired: 99.82 Bytes repaired: 37.890GiB Bytes unrepaired: 68.428MiB Bytes pending repair: 0.000KiB Bloom filter false positives: 10002428 Bloom filter false ratio: 0.00684 Bloom filter space used: 1066063088 Bloom filter off heap memory used: 1066062952 Index summary off heap memory used: 212847456 Compression metadata off heap memory used: 19900720 Compacted partition minimum bytes: 36 Compacted partition maximum bytes: 42510 Compacted partition mean bytes: 50 Average live cells per slice (last five minutes): 1.0 Maximum live cells per slice (last five minutes): 1 Average tombstones per slice (last five minutes): 1.0 Maximum tombstones per slice (last five minutes): 1 Dropped Mutations: 0 Droppable tombstone ratio: 0.98956 ----------------- directory_entry
% /opt/cassandra/bin/nodetool  -u cassandra --password $PASS tablestats swh.directory_entry
Total number of tables: 85
----------------
Keyspace : swh
        Read Count: 3059084073
        Read Latency: 0.1052384721134142 ms
        Write Count: 24985163702
        Write Latency: 0.18109138858573168 ms
        Pending Flushes: 0
                Table: directory_entry
                SSTable count: 21
                Old SSTable count: 0
                Space used (live): 1047811229206  <----------------------------------
                Space used (total): 1047811229206
                Space used by snapshots (total): 0
                Off heap memory used (total): 2001366904
                SSTable Compression Ratio: 0.7031179226071164   <--------------------
                Number of partitions (estimate): 856572594
                Memtable cell count: 69645
                Memtable data size: 7766129
                Memtable off heap memory used: 0
                Memtable switch count: 26657
                Local read count: 2146387
                Local read latency: NaN ms
                Local write count: 18167997151
                Local write latency: 0.035 ms
                Pending flushes: 0
                Percent repaired: 99.91
                Bytes repaired: 1350.959GiB
                Bytes unrepaired: 1.196GiB
                Bytes pending repair: 0.000KiB
                Bloom filter false positives: 366179
                Bloom filter false ratio: 0.00000
                Bloom filter space used: 1079272072
                Bloom filter off heap memory used: 1079271904
                Index summary off heap memory used: 213176352
                Compression metadata off heap memory used: 708918648
                Compacted partition minimum bytes: 73
                Compacted partition maximum bytes: 43388628
                Compacted partition mean bytes: 1867
                Average live cells per slice (last five minutes): NaN
                Maximum live cells per slice (last five minutes): 0
                Average tombstones per slice (last five minutes): NaN
                Maximum tombstones per slice (last five minutes): 0
                Dropped Mutations: 0
                Droppable tombstone ratio: 0.00000

----------------
Edited by Vincent SellierUpdate of the
content_by_sha1_gittable:cqlsh:swh> desc table content_by_sha1_git; CREATE TABLE swh.content_by_sha1_git ( sha1_git blob, target_token bigint, PRIMARY KEY (sha1_git, target_token) ) WITH CLUSTERING ORDER BY (target_token ASC) AND additional_write_policy = '99p' AND bloom_filter_fp_chance = 0.01 AND caching = {'keys': 'ALL', 'rows_per_partition': 'NONE'} AND cdc = false AND comment = '' AND compaction = {'class': 'org.apache.cassandra.db.compaction.SizeTieredCompactionStrategy', 'max_threshold': '32', 'min_threshold': '4'} AND compression = {'chunk_length_in_kb': '16', 'class': 'org.apache.cassandra.io.compress.LZ4Compressor'} AND crc_check_chance = 1.0 AND default_time_to_live = 0 AND extensions = {} AND gc_grace_seconds = 864000 AND max_index_interval = 2048 AND memtable_flush_period_in_ms = 0 AND min_index_interval = 128 AND read_repair = 'BLOCKING' AND speculative_retry = '99p'; cqlsh:swh> alter table content_by_sha1_git with compression = {'class': 'ZstdCompressor', 'compression_level':'3'}; cqlsh:swh> desc table content_by_sha1_git; ... AND compression = {'chunk_length_in_kb': '16', 'class': 'org.apache.cassandra.io.compress.ZstdCompressor', 'compression_level': '3'} ...% /opt/cassandra/bin/nodetool -u cassandra --password $PASS scrub -j 0 swh content_by_sha1_git <--- blockin% /opt/cassandra/bin/nodetool -u cassandra --password $PASS compactionstats pending tasks: 4 - swh.content_by_sha1_git: 4 id compaction type keyspace table completed total unit progress 91416bd3-fa43-11ed-a9b2-058960bcad6b Scrub swh content_by_sha1_git 542868635 1314337940 bytes 41.30% a98657a0-fa43-11ed-a9b2-058960bcad6b Scrub swh content_by_sha1_git 219845606 17723080252 bytes 1.24% b2a14660-fa43-11ed-a9b2-058960bcad6b Scrub swh content_by_sha1_git 68059156 3993244252 bytes 1.70% 91416bd0-fa43-11ed-a9b2-058960bcad6b Scrub swh content_by_sha1_git 513149040 7735508733 bytes 6.63% Active compaction remaining time : 0h02m55sit must be launched on each node
Edited by Vincent SellierAfter the sshtables compression:
 % /opt/cassandra/bin/nodetool  -u cassandra --password $PASS tablestats swh.content_by_sha1_git
Total number of tables: 85
----------------
Keyspace : swh
        Read Count: 3059118197
        Read Latency: 0.10523901771030524 ms
        Write Count: 24985316393
        Write Latency: 0.18109044024748203 ms
        Pending Flushes: 0
                Table: content_by_sha1_git
                SSTable count: 15
                Old SSTable count: 0
                Space used (live): 63807028877 <----------------------------
                Space used (total): 63807028877
                Space used by snapshots (total): 67287417379 <-------------- the snapshot
                Off heap memory used (total): 1430122664
                SSTable Compression Ratio: 0.720077607495494 <--------------
                Number of partitions (estimate): 951511557
                Memtable cell count: 10817
                Memtable data size: 400229
                Memtable off heap memory used: 0
                Memtable switch count: 1333
                Local read count: 645186722
                Local read latency: 0.228 ms
                Local write count: 942677363
                Local write latency: 0.013 ms
                Pending flushes: 0
                Percent repaired: 99.67
                Bytes repaired: 46.412GiB
                Bytes unrepaired: 158.807MiB
                Bytes pending repair: 0.000KiB
                Bloom filter false positives: 493
                Bloom filter false ratio: 0.06667
                Bloom filter space used: 1169794304
                Bloom filter off heap memory used: 1169794184
                Index summary off heap memory used: 235913984
                Compression metadata off heap memory used: 24414496
                Compacted partition minimum bytes: 43
                Compacted partition maximum bytes: 60
                Compacted partition mean bytes: 60
                Average live cells per slice (last five minutes): 1.0
                Maximum live cells per slice (last five minutes): 1
                Average tombstones per slice (last five minutes): 1.0
                Maximum tombstones per slice (last five minutes): 1
                Dropped Mutations: 0
                Droppable tombstone ratio: 0.00000

----------------
The zstd compression level 3 is ~5% better than the lz4 compression
On the cluster, the data occupation changed from 186G to 178Go
Snapshot are created by default by the recompression process. It can be disabled with the
--no-snapshotoption:-ns, --no-snapshot Scrubbed CFs will be snapshotted first, if disableSnapshot is false. (default false)It will not fit for the big tables in production
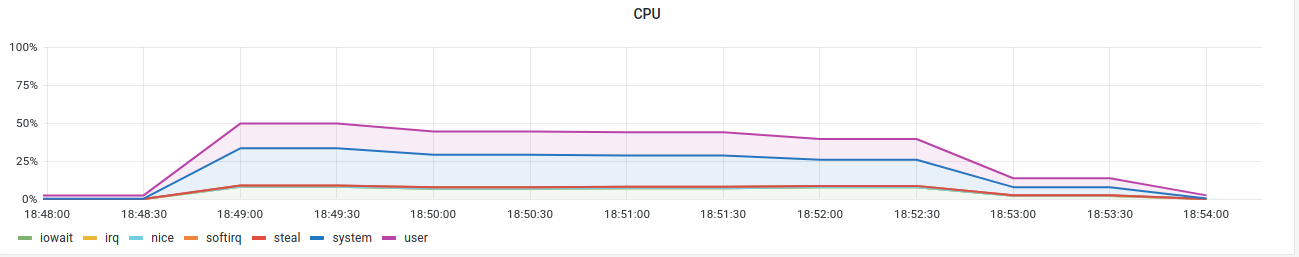
Edited by Vincent SellierThe bench for 200 users show the cpu load is quite higher with zstd and the read is slower :
- load

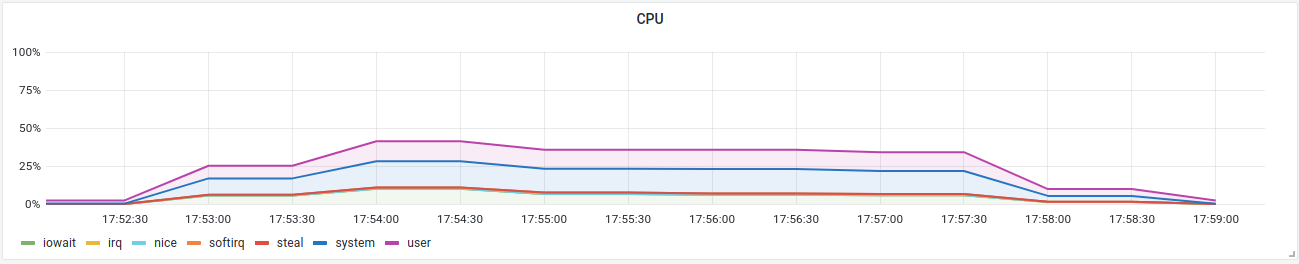
~ 40% of cpu load instead of < 10%
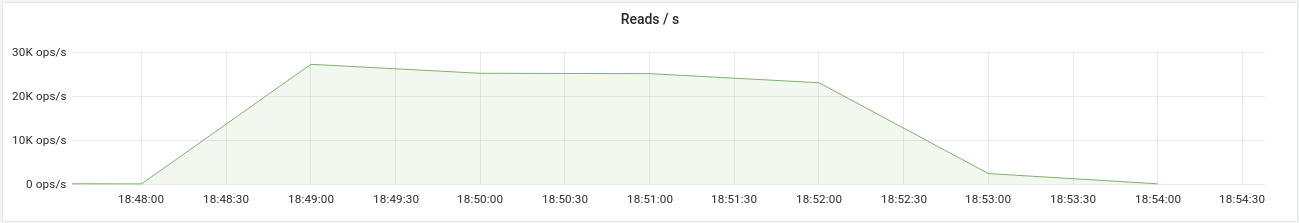
- reads
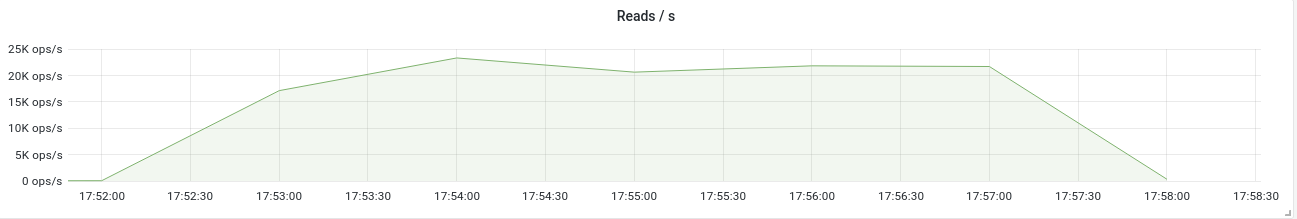
~22k read/s instead of ~25k
- the response times
before after 99th p 5246 5583 95th p 1855 2066 75th p 379 449 50th p 161 181 Mean 474 529 Let's try with a compression ratio of 1
with a compression level of 1, the performance are a almost the same as with lz4 but at the cost of a higher cpu load. The compression ratio is better by 4.8%
cpu:
Read:

Response times:
200u lz4 zstd 3 zstd 1 99th p 5246 5583 5243 95th p 1855 2066 1590 75th p 379 449 359 50th p 161 181 161 Mean 474 529 464 The response time are even better than std4 but the cpu cost doesn't worth it for this not so big table.
The compression algo is reconfigured to be lz4 on this table.
The same tests will be done for the directory_entry table (the recompression will take more time

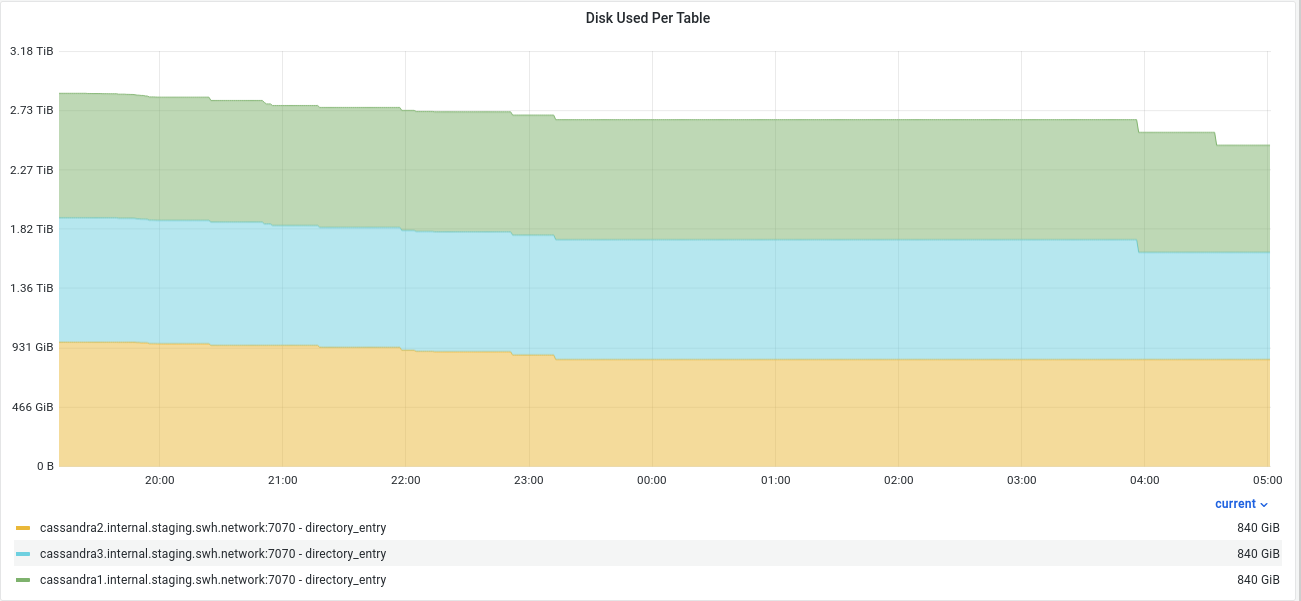
The directory_entry recompression is finished.
The compression ratio gained is a little less than 15% with a gain of ~130Go on of 1To per node. The benchmarks doesn't show any slowness, only a few ms on the 99th percentile which is good.
% /opt/cassandra/bin/nodetool -h cassandra3 -u cassandra --password $PASS tablestats swh.directory_entry
Total number of tables: 85
----------------
Keyspace : swh
        Read Count: 3544391736
        Read Latency: 0.11045884629610252 ms
        Write Count: 24989235623
        Write Latency: 0.18533515041749782 ms
        Pending Flushes: 0
                Table: directory_entry
                SSTable count: 20
                Old SSTable count: 0
                Space used (live): 901961036504   <-------------------------
                Space used (total): 901961036504
                Space used by snapshots (total): 0
                Off heap memory used (total): 1841508240
                SSTable Compression Ratio: 0.6027883770455752 <-------------
                Number of partitions (estimate): 856588923
                Memtable cell count: 247492
                Memtable data size: 27336607
                Memtable off heap memory used: 0
                Memtable switch count: 26766
                Local read count: 2692055
                Local read latency: 0.770 ms
                Local write count: 18169530469
                Local write latency: 0.023 ms
                Pending flushes: 0
                Percent repaired: 99.91
                Bytes repaired: 1350.826GiB
                Bytes unrepaired: 1.275GiB
                Bytes pending repair: 0.000KiB
                Bloom filter false positives: 54205
                Bloom filter false ratio: 0.00000
                Bloom filter space used: 1075494840
                Bloom filter off heap memory used: 1075494680
                Index summary off heap memory used: 57123392
                Compression metadata off heap memory used: 708890168
                Compacted partition minimum bytes: 73
                Compacted partition maximum bytes: 43388628
                Compacted partition mean bytes: 1867
                Average live cells per slice (last five minutes): 29.32591867982307
                Maximum live cells per slice (last five minutes): 1109
                Average tombstones per slice (last five minutes): 1.0
                Maximum tombstones per slice (last five minutes): 1
                Dropped Mutations: 0
                Droppable tombstone ratio: 0.00000

----------------
The bench doesn't show any significant change on the response time and cpu usage:
- load
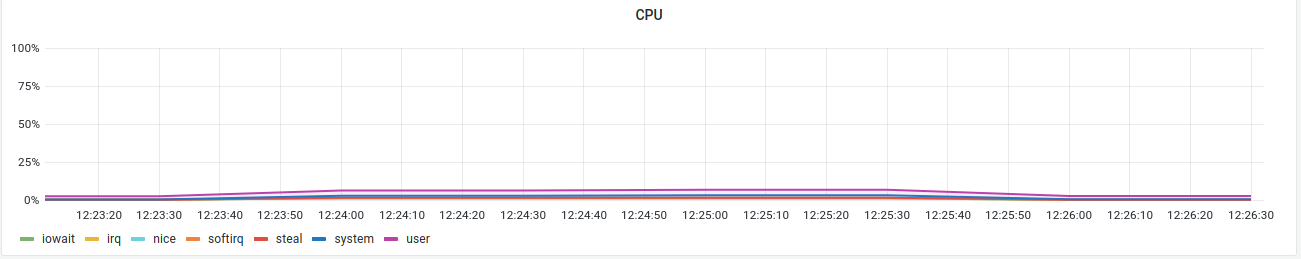
- cassandra


- Response times:
200u lz4 zstd1 99th p 431 447 95th p 263 263 75th p 147 147 50th p 94 94 Mean 114 114 Let's check the zstd3 impact.
mentioned in commit swh/infra/ci-cd/swh-charts@d70ba63d
The recompression to zstd level 3 is finished:
% /opt/cassandra/bin/nodetool -h cassandra3 -u cassandra --password $PASS tablestats swh.directory_entry  | grep -e "Space used" -e "SSTable Compression"
                Space used (live): 884251749954
                Space used (total): 884251749954
                Space used by snapshots (total): 0
                SSTable Compression Ratio: 0.5903938721604192
The gain is 2% compared to zstd level 1.
The response time difference:
200u zstd1 zstd3 99th p 447 644 95th p 263 408 75th p 147 217 50th p 94 128 Mean 114 169 it's significantly slower with zstd level3 than zstd level 1
mentioned in issue #4892 (closed)
mentioned in commit swh/devel/snippets@3c5075be