Declare service monitor to scrape external metrics in clusters
This migrates the equivalent static declarations done in the k8s-cluster-config in this repository (cassandra for production and staging cluster).
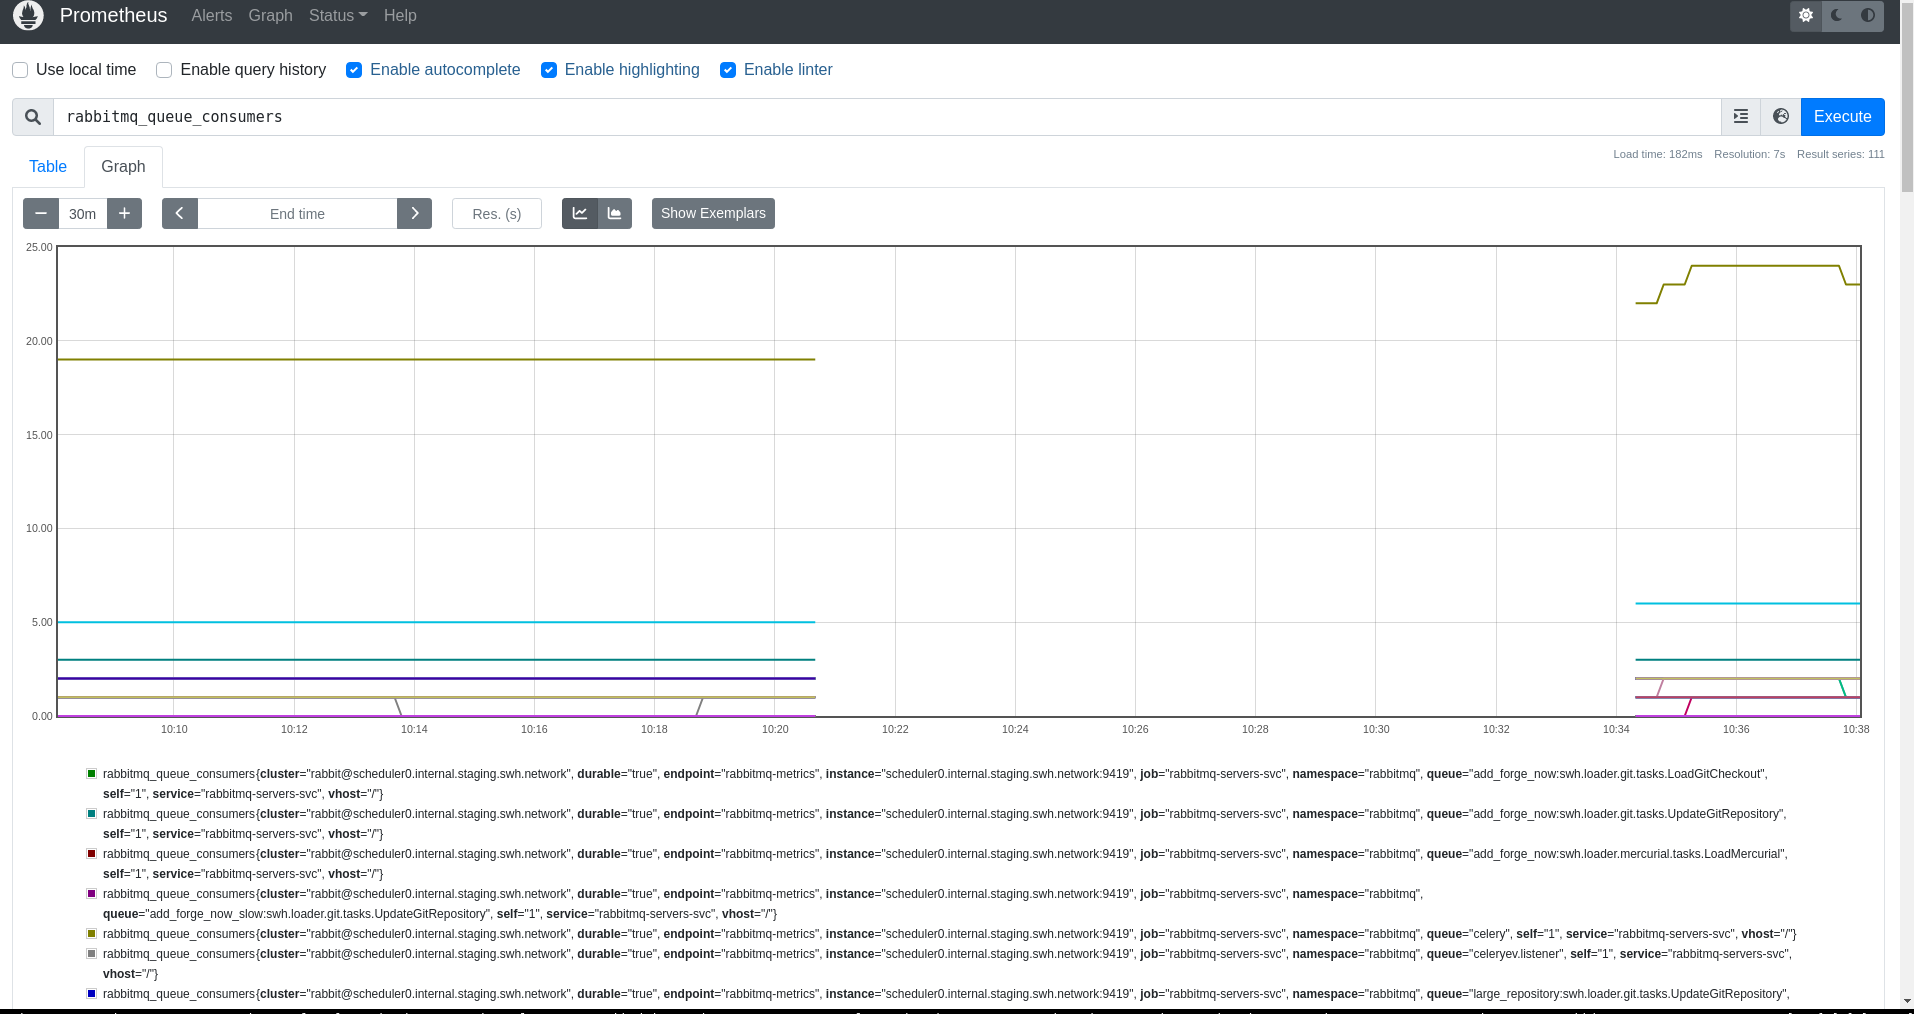
This also adds the scraping of the rabbitmq metrics in the test-staging-rke2. The end goal being to actually scrape it in staging and production cluster (decommissionning the ones from pergamon to be able to finally define alertmanager alerts starting with rabbitmq and then adding other alerts for extra services declared outside the cluster like kafka, postgresql, ...)
This avoids duplicated static crds in k8s-cluster-config too [1]
[1] k8s-clusters-conf!35 (closed)
helm diff
[cluster-components] Comparing changes between branches production and add-template-to-scrape-external-metrics...
Your branch is up to date with 'origin/production'.
[cluster-components] Generate config in production branch for cluster-components/values/admin-rke2.yaml...
[cluster-components] Generate config in production branch for cluster-components/values/archive-production-rke2.yaml...
[cluster-components] Generate config in production branch for cluster-components/values/archive-staging-rke2.yaml...
[cluster-components] Generate config in production branch for cluster-components/values/gitlab-production.yaml...
[cluster-components] Generate config in production branch for cluster-components/values/gitlab-staging.yaml...
[cluster-components] Generate config in production branch for cluster-components/values/minikube.yaml...
[cluster-components] Generate config in production branch for cluster-components/values/rancher.yaml...
[cluster-components] Generate config in production branch for cluster-components/values/test-staging-rke2.yaml...
[cluster-components] Generate config in add-template-to-scrape-external-metrics branch for cluster-components/values/admin-rke2.yaml...
[cluster-components] Generate config in add-template-to-scrape-external-metrics branch for cluster-components/values/archive-production-rke2.yaml...
[cluster-components] Generate config in add-template-to-scrape-external-metrics branch for cluster-components/values/archive-staging-rke2.yaml...
[cluster-components] Generate config in add-template-to-scrape-external-metrics branch for cluster-components/values/gitlab-production.yaml...
[cluster-components] Generate config in add-template-to-scrape-external-metrics branch for cluster-components/values/gitlab-staging.yaml...
[cluster-components] Generate config in add-template-to-scrape-external-metrics branch for cluster-components/values/minikube.yaml...
[cluster-components] Generate config in add-template-to-scrape-external-metrics branch for cluster-components/values/rancher.yaml...
[cluster-components] Generate config in add-template-to-scrape-external-metrics branch for cluster-components/values/test-staging-rke2.yaml...


------------- diff for cluster-components/values/admin-rke2.yaml -------------

--- /tmp/swh-chart.cluster-components.mac4gUdB/admin-rke2.yaml.before   2024-02-07 10:58:35.381437503 +0100
+++ /tmp/swh-chart.cluster-components.mac4gUdB/admin-rke2.yaml.after    2024-02-07 10:58:36.641434853 +0100
@@ -363,20 +363,30 @@
   tls:
   - hosts:
     - alertmanager-irc-relay.admin.swh.network
     - alertmanager-irc-relay.internal.admin.swh.network
     secretName: alertmanager-irc-relay-crt
 ---
 # Source: cluster-config/templates/alertmanager-irc-relay/config.yaml
 # See https://gitlab.softwareheritage.org/swh/infra/ci-cd/3rdparty/alertmanager-irc-relay/-/tree/master
 # for more information
 ---
+# Source: cluster-config/templates/scrape-external-metrics/endpoints.yaml
+# This defines the external endpoints ips to connect to scrape metrics
+---
+# Source: cluster-config/templates/scrape-external-metrics/service-monitor.yaml
+# This defines the service-monitor to monitor the service which scrapes external metrics
+# This may redefine some metrics, see the relabeling configuration dict key
+---
+# Source: cluster-config/templates/scrape-external-metrics/service.yaml
+# This defines a service to be monitored by the service monitor
+---
 # Source: cluster-config/templates/alertmanager-config/config.yaml
 apiVersion: monitoring.coreos.com/v1alpha1
 kind: AlertmanagerConfig
 metadata:
   name: irc-relay-config
   namespace: cattle-monitoring-system
 spec:
   route:
     groupBy: ['...']
     groupWait: 31s


------------- diff for cluster-components/values/archive-production-rke2.yaml -------------

--- /tmp/swh-chart.cluster-components.mac4gUdB/archive-production-rke2.yaml.before      2024-02-07 10:58:35.453437396 +0100
+++ /tmp/swh-chart.cluster-components.mac4gUdB/archive-production-rke2.yaml.after       2024-02-07 10:58:36.709434670 +0100
@@ -2,20 +2,38 @@
 # Source: cluster-config/templates/pod-priority/priority.yaml
 apiVersion: scheduling.k8s.io/v1
 kind: PriorityClass
 metadata:
   name: cluster-components-system
   namespace: cluster-components
 value: 75000
 globalDefault: false
 description: Highest pod priorities (ingress, operator, collector, controller)
 ---
+# Source: cluster-config/templates/scrape-external-metrics/service.yaml
+# This defines a service to be monitored by the service monitor---
+apiVersion: v1
+kind: Service
+metadata:
+  namespace: cassandra
+  name: cassandra-servers-svc
+  labels:
+    app: cassandra
+spec:
+  type: ExternalName
+  externalName: "fake-url"
+  ports:
+    - name: jmx-exporter
+      port: 7070
+      targetPort: 7070
+      protocol: TCP
+---
 # Source: cluster-config/templates/alertmanager-config/config.yaml
 apiVersion: monitoring.coreos.com/v1alpha1
 kind: AlertmanagerConfig
 metadata:
   name: irc-relay-config
   namespace: cattle-monitoring-system
 spec:
   route:
     groupBy: ['...']
     groupWait: 31s
@@ -38,20 +56,46 @@
           url: https://alertmanager-irc-relay.internal.admin.swh.network/swh-sysadm
           httpConfig:
             basicAuth:
               username:
                 key: user
                 name: alertmanager-irc-relay-config
               password:
                 key: password
                 name: alertmanager-irc-relay-config
 ---
+# Source: cluster-config/templates/scrape-external-metrics/endpoints.yaml
+# This defines the external endpoints ips to connect to scrape metrics---
+apiVersion: v1
+kind: Endpoints
+metadata:
+  namespace: cassandra
+  name: cassandra-servers-svc
+  labels:
+    app: cassandra
+subsets:
+  - addresses:
+    - ip: 192.168.100.181
+    - ip: 192.168.100.182
+    - ip: 192.168.100.183
+    - ip: 192.168.100.184
+    - ip: 192.168.100.185
+    - ip: 192.168.100.186
+    - ip: 192.168.100.187
+    - ip: 192.168.100.188
+    - ip: 192.168.100.189
+    - ip: 192.168.100.190
+    ports:
+      - name: jmx-exporter
+        port: 7070
+        protocol: TCP
+---
 # Source: cluster-config/templates/alerting/swh-alerting.yaml
 apiVersion: monitoring.coreos.com/v1
 kind: PrometheusRule
 metadata:
   name: swh-production.rules
   namespace: cattle-monitoring-system
 spec:
   groups:
   - name: swh-production.rules
     rules:
@@ -84,10 +128,44 @@
         namespace: cattle-monitoring-system
     - alert: Cronjob_Is_Suspended_In_Production
       annotations:
         description: "The cronjob {{ $labels.cronjob }} is suspended for more than 5 minutes."
         summary: "Please set the suspension field of cronjob  {{ $labels.cronjob }} to 'false' on cluster {{ $labels.cluster_name }}."
       expr: kube_cronjob_spec_suspend > 0
       for: 5m
       labels:
         severity: warning
         namespace: cattle-monitoring-system
+---
+# Source: cluster-config/templates/scrape-external-metrics/service-monitor.yaml
+# This defines the service-monitor to monitor the service which scrapes external metrics
+# This may redefine some metrics, see the relabeling configuration dict key---
+apiVersion: monitoring.coreos.com/v1
+kind: ServiceMonitor
+metadata:
+  namespace: cassandra
+  name: cassandra-servers-svc
+  labels:
+    app: cassandra
+spec:
+  selector:
+    matchLabels:
+      app: cassandra
+  namespaceSelector:
+    any: true
+  endpoints:
+    - port: jmx-exporter
+      interval: 30s
+      honorLabels: true
+      relabelings:
+        - action: replace
+          regex: 192.168.100.18(\d)(.*)
+          replacement: cassandra0$1.internal.softwareheritage.org$2
+          sourceLabels:
+          - __address__
+          targetLabel: __address__
+        - action: replace
+          regex: 192.168.100.19(\d)(.*)
+          replacement: cassandra1$1.internal.softwareheritage.org$2
+          sourceLabels:
+          - __address__
+          targetLabel: __address__


------------- diff for cluster-components/values/archive-staging-rke2.yaml -------------

--- /tmp/swh-chart.cluster-components.mac4gUdB/archive-staging-rke2.yaml.before 2024-02-07 10:58:35.525437288 +0100
+++ /tmp/swh-chart.cluster-components.mac4gUdB/archive-staging-rke2.yaml.after  2024-02-07 10:58:36.793434442 +0100
@@ -58,20 +58,38 @@
       ports:
         - protocol: TCP
           port: 6379
     - from:
         - ipBlock:
             cidr: 0.0.0.0/0
       ports:
         - protocol: TCP
           port: 9121
 ---
+# Source: cluster-config/templates/scrape-external-metrics/service.yaml
+# This defines a service to be monitored by the service monitor---
+apiVersion: v1
+kind: Service
+metadata:
+  namespace: cassandra
+  name: cassandra-servers-svc
+  labels:
+    app: cassandra
+spec:
+  type: ExternalName
+  externalName: "fake-url"
+  ports:
+    - name: jmx-exporter
+      port: 7070
+      targetPort: 7070
+      protocol: TCP
+---
 # Source: cluster-config/templates/svix/services.yaml
 apiVersion: v1
 kind: Service
 metadata:
   name: svix
   namespace: svix-server
 spec:
   type: ClusterIP
   selector:
     app: svix-server
@@ -218,20 +236,39 @@
           url: https://alertmanager-irc-relay.internal.admin.swh.network/swh-sysadm
           httpConfig:
             basicAuth:
               username:
                 key: user
                 name: alertmanager-irc-relay-config
               password:
                 key: password
                 name: alertmanager-irc-relay-config
 ---
+# Source: cluster-config/templates/scrape-external-metrics/endpoints.yaml
+# This defines the external endpoints ips to connect to scrape metrics---
+apiVersion: v1
+kind: Endpoints
+metadata:
+  namespace: cassandra
+  name: cassandra-servers-svc
+  labels:
+    app: cassandra
+subsets:
+  - addresses:
+    - ip: 192.168.130.181
+    - ip: 192.168.130.182
+    - ip: 192.168.130.183
+    ports:
+      - name: jmx-exporter
+        port: 7070
+        protocol: TCP
+---
 # Source: cluster-config/templates/alerting/swh-alerting.yaml
 apiVersion: monitoring.coreos.com/v1
 kind: PrometheusRule
 metadata:
   name: swh-staging.rules
   namespace: cattle-monitoring-system
 spec:
   groups:
   - name: swh-staging.rules
     rules:
@@ -264,10 +301,38 @@
         namespace: cattle-monitoring-system
     - alert: Cronjob_Is_Suspended_In_Staging
       annotations:
         description: "The cronjob {{ $labels.cronjob }} is suspended for more than 5 minutes."
         summary: "Please set the suspension field of cronjob  {{ $labels.cronjob }} to 'false' on cluster {{ $labels.cluster_name }}."
       expr: kube_cronjob_spec_suspend > 0
       for: 5m
       labels:
         severity: warning
         namespace: cattle-monitoring-system
+---
+# Source: cluster-config/templates/scrape-external-metrics/service-monitor.yaml
+# This defines the service-monitor to monitor the service which scrapes external metrics
+# This may redefine some metrics, see the relabeling configuration dict key---
+apiVersion: monitoring.coreos.com/v1
+kind: ServiceMonitor
+metadata:
+  namespace: cassandra
+  name: cassandra-servers-svc
+  labels:
+    app: cassandra
+spec:
+  selector:
+    matchLabels:
+      app: cassandra
+  namespaceSelector:
+    any: true
+  endpoints:
+    - port: jmx-exporter
+      interval: 30s
+      honorLabels: true
+      relabelings:
+        - action: replace
+          regex: 192.168.130.18(\d)(.*)
+          replacement: cassandra$1.internal.staging.swh.network$2
+          sourceLabels:
+          - __address__
+          targetLabel: __address__


------------- diff for cluster-components/values/gitlab-production.yaml -------------

--- /tmp/swh-chart.cluster-components.mac4gUdB/gitlab-production.yaml.before    2024-02-07 10:58:35.593437186 +0100
+++ /tmp/swh-chart.cluster-components.mac4gUdB/gitlab-production.yaml.after     2024-02-07 10:58:36.861434259 +0100
@@ -1,11 +1,21 @@
 ---
+# Source: cluster-config/templates/scrape-external-metrics/endpoints.yaml
+# This defines the external endpoints ips to connect to scrape metrics
+---
+# Source: cluster-config/templates/scrape-external-metrics/service-monitor.yaml
+# This defines the service-monitor to monitor the service which scrapes external metrics
+# This may redefine some metrics, see the relabeling configuration dict key
+---
+# Source: cluster-config/templates/scrape-external-metrics/service.yaml
+# This defines a service to be monitored by the service monitor
+---
 # Source: cluster-config/templates/alertmanager-config/config.yaml
 apiVersion: monitoring.coreos.com/v1alpha1
 kind: AlertmanagerConfig
 metadata:
   name: irc-relay-config
   namespace: cattle-monitoring-system
 spec:
   route:
     groupBy: ['...']
     groupWait: 31s


------------- diff for cluster-components/values/gitlab-staging.yaml -------------

--- /tmp/swh-chart.cluster-components.mac4gUdB/gitlab-staging.yaml.before       2024-02-07 10:58:35.657437091 +0100
+++ /tmp/swh-chart.cluster-components.mac4gUdB/gitlab-staging.yaml.after        2024-02-07 10:58:36.929434076 +0100
@@ -1,11 +1,21 @@
 ---
+# Source: cluster-config/templates/scrape-external-metrics/endpoints.yaml
+# This defines the external endpoints ips to connect to scrape metrics
+---
+# Source: cluster-config/templates/scrape-external-metrics/service-monitor.yaml
+# This defines the service-monitor to monitor the service which scrapes external metrics
+# This may redefine some metrics, see the relabeling configuration dict key
+---
+# Source: cluster-config/templates/scrape-external-metrics/service.yaml
+# This defines a service to be monitored by the service monitor
+---
 # Source: cluster-config/templates/alertmanager-config/config.yaml
 apiVersion: monitoring.coreos.com/v1alpha1
 kind: AlertmanagerConfig
 metadata:
   name: irc-relay-config
   namespace: cattle-monitoring-system
 spec:
   route:
     groupBy: ['...']
     groupWait: 31s


------------- diff for cluster-components/values/minikube.yaml -------------

--- /tmp/swh-chart.cluster-components.mac4gUdB/minikube.yaml.before     2024-02-07 10:58:36.413435468 +0100
+++ /tmp/swh-chart.cluster-components.mac4gUdB/minikube.yaml.after      2024-02-07 10:58:37.689432025 +0100
@@ -41883,20 +41883,30 @@
   tls:
   - hosts:
     - alertmanager-irc-relay.admin.swh.network
     - alertmanager-irc-relay.internal.admin.swh.network
     secretName: alertmanager-irc-relay-crt
 ---
 # Source: cluster-config/templates/alertmanager-irc-relay/config.yaml
 # See https://gitlab.softwareheritage.org/swh/infra/ci-cd/3rdparty/alertmanager-irc-relay/-/tree/master
 # for more information
 ---
+# Source: cluster-config/templates/scrape-external-metrics/endpoints.yaml
+# This defines the external endpoints ips to connect to scrape metrics
+---
+# Source: cluster-config/templates/scrape-external-metrics/service-monitor.yaml
+# This defines the service-monitor to monitor the service which scrapes external metrics
+# This may redefine some metrics, see the relabeling configuration dict key
+---
+# Source: cluster-config/templates/scrape-external-metrics/service.yaml
+# This defines a service to be monitored by the service monitor
+---
 # Source: cluster-config/charts/prometheus/templates/alertmanager/alertmanager.yaml
 apiVersion: monitoring.coreos.com/v1
 kind: Alertmanager
 metadata:
   name: test-prometheus-alertmanager
   namespace: cattle-monitoring-system
   labels:
     app: prometheus-alertmanager

     app.kubernetes.io/managed-by: Helm


------------- diff for cluster-components/values/rancher.yaml -------------

--- /tmp/swh-chart.cluster-components.mac4gUdB/rancher.yaml.before      2024-02-07 10:58:36.489435263 +0100
+++ /tmp/swh-chart.cluster-components.mac4gUdB/rancher.yaml.after       2024-02-07 10:58:37.765431819 +0100
@@ -1,11 +1,21 @@
 ---
+# Source: cluster-config/templates/scrape-external-metrics/endpoints.yaml
+# This defines the external endpoints ips to connect to scrape metrics
+---
+# Source: cluster-config/templates/scrape-external-metrics/service-monitor.yaml
+# This defines the service-monitor to monitor the service which scrapes external metrics
+# This may redefine some metrics, see the relabeling configuration dict key
+---
+# Source: cluster-config/templates/scrape-external-metrics/service.yaml
+# This defines a service to be monitored by the service monitor
+---
 # Source: cluster-config/templates/alertmanager-config/config.yaml
 apiVersion: monitoring.coreos.com/v1alpha1
 kind: AlertmanagerConfig
 metadata:
   name: irc-relay-config
   namespace: cattle-monitoring-system
 spec:
   route:
     groupBy: ['...']
     groupWait: 31s


------------- diff for cluster-components/values/test-staging-rke2.yaml -------------

--- /tmp/swh-chart.cluster-components.mac4gUdB/test-staging-rke2.yaml.before    2024-02-07 10:58:36.561435068 +0100
+++ /tmp/swh-chart.cluster-components.mac4gUdB/test-staging-rke2.yaml.after     2024-02-07 10:58:37.849431593 +0100
@@ -67,20 +67,38 @@
       app: svix-postgres
   ingress:
     - from:
         - podSelector:
             matchLabels:
              app: svix-server
       ports:
         - protocol: TCP
           port: 5432
 ---
+# Source: cluster-config/templates/scrape-external-metrics/service.yaml
+# This defines a service to be monitored by the service monitor---
+apiVersion: v1
+kind: Service
+metadata:
+  namespace: rabbitmq
+  name: rabbitmq-servers-svc
+  labels:
+    app: rabbitmq
+spec:
+  type: ExternalName
+  externalName: "fake-url"
+  ports:
+    - name: rabbitmq-metrics
+      port: 9419
+      targetPort: 9419
+      protocol: TCP
+---
 # Source: cluster-config/templates/svix/services.yaml
 apiVersion: v1
 kind: Service
 metadata:
   name: postgres
   namespace: svix-server
 spec:
   type: ClusterIP
   selector:
     app: svix-postgres
@@ -369,10 +387,55 @@
         - sendResolved: true
           url: https://alertmanager-irc-relay.internal.admin.swh.network/swh-sysadm
           httpConfig:
             basicAuth:
               username:
                 key: user
                 name: alertmanager-irc-relay-config
               password:
                 key: password
                 name: alertmanager-irc-relay-config
+---
+# Source: cluster-config/templates/scrape-external-metrics/endpoints.yaml
+# This defines the external endpoints ips to connect to scrape metrics---
+apiVersion: v1
+kind: Endpoints
+metadata:
+  namespace: rabbitmq
+  name: rabbitmq-servers-svc
+  labels:
+    app: rabbitmq
+subsets:
+  - addresses:
+    - ip: 192.168.130.50
+    ports:
+      - name: rabbitmq-metrics
+        port: 9419
+        protocol: TCP
+---
+# Source: cluster-config/templates/scrape-external-metrics/service-monitor.yaml
+# This defines the service-monitor to monitor the service which scrapes external metrics
+# This may redefine some metrics, see the relabeling configuration dict key---
+apiVersion: monitoring.coreos.com/v1
+kind: ServiceMonitor
+metadata:
+  namespace: rabbitmq
+  name: rabbitmq-servers-svc
+  labels:
+    app: rabbitmq
+spec:
+  selector:
+    matchLabels:
+      app: rabbitmq
+  namespaceSelector:
+    any: true
+  endpoints:
+    - port: rabbitmq-metrics
+      interval: 30s
+      honorLabels: true
+      relabelings:
+        - action: replace
+          regex: 192.168.130.50.*
+          replacement: scheduler0.internal.staging.swh.network
+          sourceLabels:
+          - __address__
+ targetLabel: __address__Merge request reports
Activity
added 1 commit
- c874d658 - Declare service monitor to scrape external metrics in clusters
mentioned in merge request k8s-clusters-conf!35 (closed)
not exactly, we are are not constrained by a template in k8s-cluster-config but let's say it's ok for the current feature.
Edited by Vincent Sellier
added 6 commits
-
5362e0c9...dda41bc5 - 5 commits from branch
production - f0453f45 - Declare service monitor to scrape external metrics in clusters
-
5362e0c9...dda41bc5 - 5 commits from branch
added 5 commits
-
f0453f45...f6b13e98 - 4 commits from branch
production - 27ef47d3 - Declare service monitor to scrape external metrics in clusters
-
f0453f45...f6b13e98 - 4 commits from branch
mentioned in merge request swh/infra/puppet/puppet-swh-site!692 (merged)
mentioned in issue swh/infra/sysadm-environment#5048 (closed)