[cassandra] holes in the monitoring
Prometheus is regularly missing cassandra metrics during a certain amount of time:
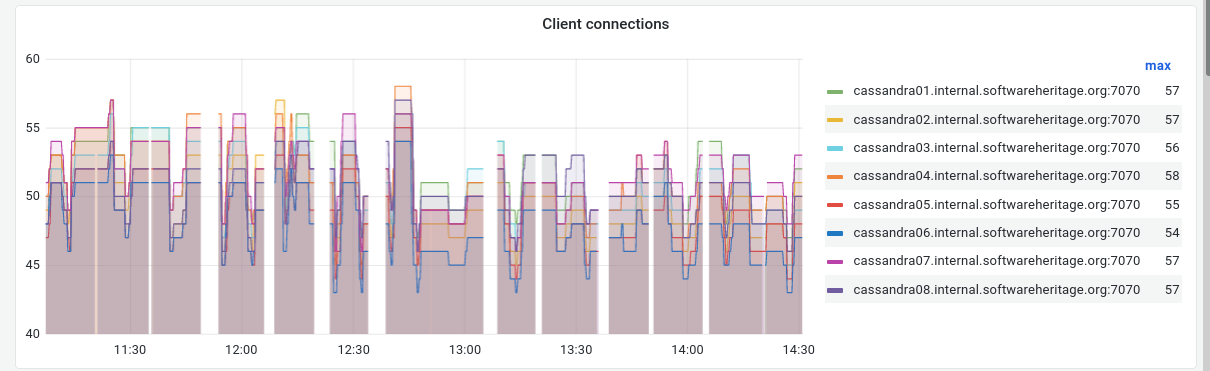
The problem is the same in production and staging, so it seems its a configuration issue or some kind of timeout somewhere
Prometheus is regularly missing cassandra metrics during a certain amount of time:
The problem is the same in production and staging, so it seems its a configuration issue or some kind of timeout somewhere